The Color drop zone drives the color logic of the visualization, assigning colors based on the given hierarchy or measure. The color function behaves differently depending on whether a hierarchy or a measure was been selected as the color driver.
When a chip is added to the Color zone, the corresponding legend is added to the canvas; the colors in the series can then be edited from the legend as required.
Depending on both the given visual and chip type, the color drop zone also presents users with the flexibility to choose the color target in the visual (i.e., which component of the visual the color logic will be applied to), and the actual logic according to which the visual should be colored (for instance, linear regression, standard deviation, or average).
Color Chips
Both hierarchies and measures can be added to the Color drop zone, where they will drive the color component of the vitalization.
Hierarchies
When a hierarchy is added to the Color zone, the visualization will be colored according to the member elements in that hierarchy, and discrete legend will be produced.

Measures
When a measure is added to the Color zone, the visualization is colored according to the range of values for that measure in the context of the query. This range is displayed in a continuous legend.

Color Logic (measures, all visuals)
When a chip is added to the Color zone, you can open the Color sub-menu and select the type of logic that should be used to drive the color component of the visualization. The sub-menu may be opened by dragging the chip over the Color zone header, or by clicking the expand button (yellow highlight below).

When working with grids and gauges, an addition color target sub-menu appears before the color logic menu; see below for details.
Coloring Schemes
There are multiple techniques for coloring the data in your visualization:
- From the Color zone, you can specify the required logic according to which the visual will be colored.
- Custom colors are configured based on user-defined color logic configured in the database. Click here to learn about custom colors.
- The Advanced sub-zone is used to customize dynamic bands and colors for KPIs. Click here to learn about advanced colors.
Color Target
The option to select the color target (i.e. the component of the visualization that will be colored) is presented when working with grids and gauges. The color target is selected from the Color sub-menu, which can be opened by dragging the chip over the Color zone header, or by clicking the expand button (yellow highlights below). Once a target is chosen the next sub-menu will open, allowing you to specify and logic type.

Background
Background may be selected as the target for both grids and gauges; selecting Background will apply the color logic to the grid's cells, or to the gauge's tile. This option is supported for both hierarchy and measure driven colors.
Grid

Gauge

Foreground
Foreground can also be selected for both grids and gauges. If Foreground is chosen as the target, the given hierarchy of measure will drive the color of the text in each tuple of the visual.
Grid

Gauge

Indicator
You can select indicators as the color target; once a measure has been a, the color of the indicators in the grid or gauge will be driven by the given measure (a hierarchy cannot be used to drive the indicator color).
Grid

Gauge

Sidebar
When working with gauges, you may select sidebars as the color target; the color of the gauges' sidebars will be driven by the given measure. Hierarchies cannot be used to drive sidebar color.

Examples
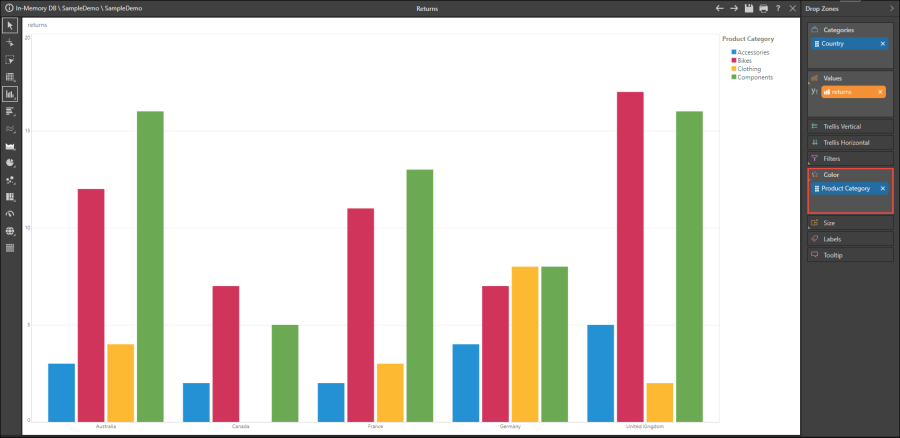
Add a hierarchy to the color zone to add a color component to the visual. This is particularly useful if the query contains multiple hierarchies.
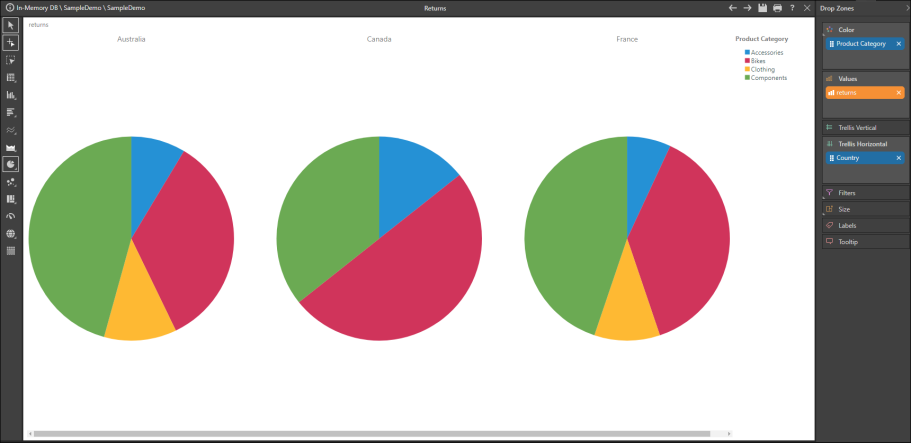
One hierarchy is added to Color, and a second to Trellis, to produce a series of pie charts (each one representing a different country) colored according to Product Category.
In this example, a tree map was built by adding a second measure (rather than hierarchy) to the Color zone. This produces a continuous legend that corresponds to the range of Net Profit values in the chart.

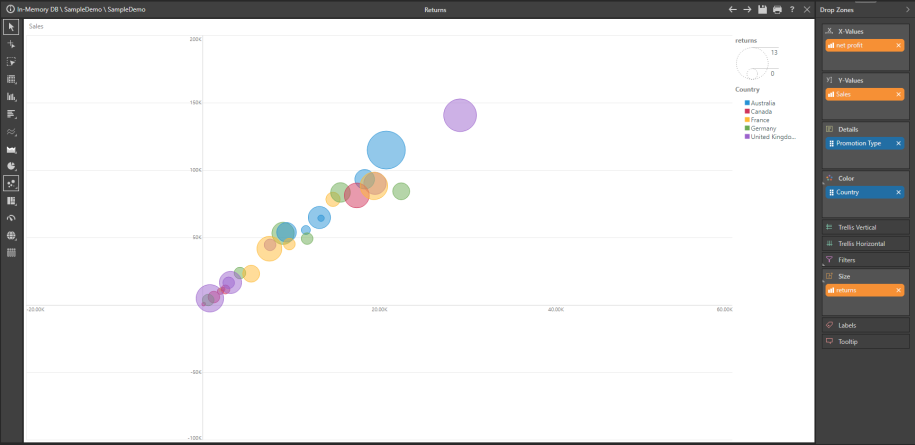
In this scatter chart, a second hierarchy (Country) is added to Color, while a third measure (Returns) is added to Size. The result is that the chart's bubbles are colored according to country, and sized according to the number of returns.
When leveraging the Color zone with grids, the blue chip can be added to the sub-menu under Foreground or Background:
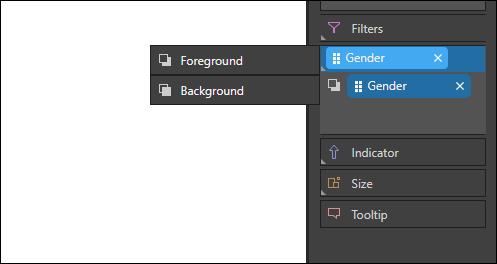
When added to Foreground, only the text will appear in color.

When added to Background, the cells will appear in color.
